The question and the decision rule
This study compares types of signage, not sign companies. It covers storefront identification, window and point-of-sale messages, illuminated signs, vehicle graphics and in-store digital screens. The audience is an Ottawa business deciding how to spend a signage budget in 2026. It is an evidence synthesis and decision framework, not a new experiment on Ottawa businesses.
Profit is the money retained after the costs needed to earn additional sales. A sign can increase transactions while reducing the amount retained if discounting, fulfilment costs, financing or upkeep absorb the gain. The relevant comparison is the incremental result against a credible alternative: the existing sign, a smaller improvement or no new purchase.
Our decision rule is to choose the lowest-cost feasible intervention that addresses a demonstrated problem, then expand only when measured additional contribution supports the expense. This is an analytical starting point, not proof that inexpensive signs always outperform premium ones. A business that cannot fulfil more orders may value clearer wayfinding or fewer missed appointments instead of more enquiries.
For company selection rather than sign-type economics, use the Ottawa sign-shop comparison to build a supplier shortlist.
What the studies actually establish
The University of Cincinnati’s 2012 report used 213 usable business-survey responses plus case studies. It explicitly says that most sign updates combined several changes, preventing identification of which change had the greatest effect. Its commissioned US evidence is useful background, not a causal league table for Ottawa. [1]
A Journal of Marketing paper in the 2026 issue reports 237 experiments involving roughly 30 million shoppers, with data collected in 2018–2022 at ten large stores of one western European retailer. Table 3 reports an odds ratio of 1.081 for featured-product purchase. That is an 8.1% increase in odds, not an 8.1-percentage-point gain or an 8.1% increase in profit. [2]
Nanni and Ordanini’s 2024 study examined digital discount messages in two grocery-store experiments with 7,009 customers. Effects depended on product location: distant discounted products benefited, while nearby discounted products did not show a significant increase. This differs from a universal claim that screens near products always work best. [3]
These findings concern different messages, settings and outcomes. We therefore do not average their effects or apply one uplift to every Ottawa sign. A digital screen inside an existing store and a roadside sign that helps someone find the entrance solve different problems.
| Evidence class | What it can help answer | What it cannot settle |
|---|---|---|
| Local rules and fee schedules | Which approval and cost questions to ask | Whether a particular sign is profitable |
| Supplier price guides | Possible order of cost and quote scope | Market-average paid prices or quality |
| Experiments elsewhere | Whether a defined message changed a measured purchase outcome | Ottawa-wide profit or the best exterior sign |
| This report’s scenarios | How assumptions change a break-even calculation | How many customers a real sign will generate |
Scroll sideways on smaller screens. Table order is not a ranking.
Which format fits which business problem?
A useful shortlist begins with the point at which customers are lost. Are people unaware the business exists, unable to locate the door, uncertain about the offer or already inside but unable to find a product? Choose a format around that question before choosing a finish.
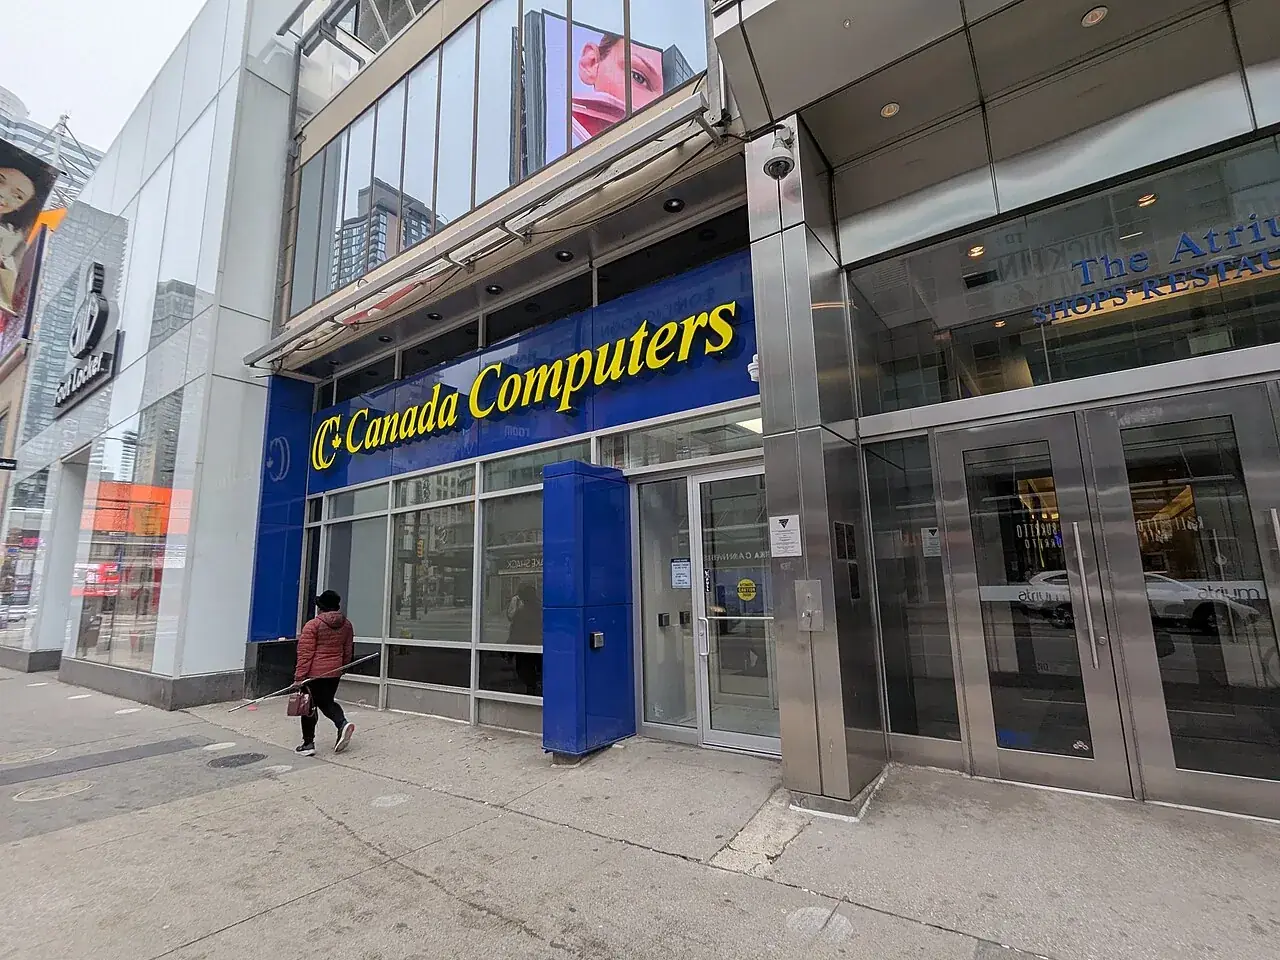
For a daytime storefront, first investigate whether the name, entrance and opening information can be understood from the actual approach. For an evening business, inspect the same view after dark. For a mobile service, investigate whether prospective customers who see the vehicle have a reason and a practical way to contact the business. These are proposed tests, not measured results for specific Ottawa neighbourhoods.
| Format | Problem worth testing | Measure and principal limit |
|---|---|---|
| Window / entrance information | People reach the frontage but miss the entrance or offer | Track entrances and completed sales; window coverage may also reduce visibility into the business |
| Fascia / flat panel | The business is difficult to identify from the normal approach | Compare qualified arrivals; a clear sign cannot create demand for an unwanted offer |
| Illuminated letters / lightbox | Relevant customers arrive after dark and existing identification is inadequate | Compare evening contribution; include electricity, servicing and installation |
| A-frame / temporary promotion | Passing pedestrians need a concise, timely reason to stop | Compare matched trading periods; placement must preserve access and meet applicable rules |
| Vehicle lettering / wrap | A service vehicle already travels or works where likely customers are present | Track qualified enquiries and completed jobs; impressions are not leads |
| In-store digital screen | An existing audience needs a relevant product message | Test category contribution, not only featured-product sales; include hardware, content and subscription costs |
Scroll sideways on smaller screens. Table order is not a ranking.
Ottawa costs: advertised ranges, not market averages
Two accessible 2026 supplier guides publish overlapping categories with different scopes. DSign LED says its ranges include design and fabrication; YAYA Prints describes materials and typical installation. Their values should not be combined into a market average or used to select the cheaper supplier. [4, 5]
The table reproduces selected advertised ranges in Canadian dollars. Dimensions, coverage, mounting conditions and included work are not matched. The plus sign means an open upper end. No purchase, quotation request or invoice audit was carried out.
| Category | DSign LED: design + fabrication | YAYA: materials + typical install |
|---|---|---|
| Window graphics | $400–$2,000 | $600–$2,000 |
| Flat / fascia panel | $600–$2,500 | $1,500–$5,000 |
| Lightbox / cabinet | $2,000–$8,000 | $1,500–$6,000 |
| Front-lit channel letters | $2,500–$10,000+ | $3,500–$5,500 (about 10 ft) |
Scroll sideways on smaller screens. Table order is not a ranking.
Permits and physical access can change the economics
Ottawa’s consolidated permanent-sign by-law lists a $426 permanent-sign permit, $677 message-centre fee and $557 digital-menu-board fee. The adopted 2026 budget corroborates these amounts. These are application categories, not the total price of a signage project. [6, 7]
Section 26 of the by-law exempts specified signs, including non-illuminated window signs, from the permit requirement while retaining applicable compliance obligations. An exemption is not permission for every design or location. Have the City assess the exact sign and property before production; also establish the landlord’s consent and any additional approval work. [6]
An A-frame must not trade visibility for a blocked route. The City’s Good Neighbours guide discusses clearways and business-hours placement. Check current site-specific requirements rather than treating an old photo of a sign on the pavement as evidence that the location is permitted. [8]
Ask how customers using mobility aids will reach the entrance, whether a sign hides essential information, and who will move temporary material during snow clearing. The aim is a discoverable business with usable access. We have not surveyed footways or certified the accessibility of any pictured location.
The Glebe resident guide adds housing, street and event context for a neighbourhood where the precise address still determines applicable permissions.
Demand: count the audience that can actually become customers
Regional traffic volume is a starting point for a question, not a count of buyers. TRANS explains that its screenline observations cover different travel modes and that the historic programme uses weekday May–June counts without seasonal normalisation. The location, direction and observation period matter. Those figures cannot be relabelled as 2026 storefront footfall or sign impressions. [9]
A retailer should count people passing the relevant side of the street during its own opening hours, then distinguish passers-by, entrants and buyers. A service business should distinguish enquiries, qualified enquiries, booked jobs and completed profitable jobs. A call caused by a vehicle graphic has little value if the job is outside the service area or cannot be fulfilled.
For an Ottawa location, record weather, construction, holidays, nearby events and changes in opening hours alongside the observations. Compare like periods where possible. A rise in summer visitors should not automatically be credited to a new sign installed in spring. We found no suitable address-level 2026 demand series that could justify a neighbourhood ROI ranking in this report.
Use a short memorable URL, a dedicated enquiry source field or a voluntary question at checkout as supporting evidence. Each can miss customers or misattribute a sale. Avoid collecting names, precise movement histories or sensitive service details merely to count a signage response. Aggregate business records are usually a more proportionate starting point.
The ByWard Market resident guide describes streets and daily activity as location context; it does not supply measured storefront footfall.
A transparent first-year break-even example
Suppose a business considers a $5,000 installed project, incurs $300 of additional annual running costs and retains $30 of contribution from each genuinely additional completed sale. All three inputs are hypothetical, selected to demonstrate the calculation. They are not Ottawa averages, a supplier quote or a forecast of signage performance.
First-year cash contribution after the project = additional completed sales × contribution per sale − initial project outlay − additional running costs. Under these assumptions, break-even requires $5,300 ÷ $30 = 176.7 additional sales, rounded up to 177 over the year, or about 15 per month.
This is a cash investment screen, not an accounting net-profit calculation: it deducts the full initial outlay rather than applying depreciation. Financing, tax treatment, residual value, later-year repairs and the timing of receipts are excluded. Those choices can change the investment decision.
| Additional sales per month | Annual additional contribution before sign costs | First-year cash contribution after $5,300 |
|---|---|---|
| 0 | $0 | −$5,300 |
| 10 | $3,600 | −$1,700 |
| 20 | $7,200 | +$1,900 |
| 30 | $10,800 | +$5,500 |
Scroll sideways on smaller screens. Table order is not a ranking.
Why more sales may still mean less profit
Contribution per sale must allow for the costs that rise with that sale: product cost, payment charges, delivery and any additional labour, for example. If $30 falls to $15, the same $5,300 first-year cost requires 354 extra completed sales rather than 177. The sign has not changed; the economics have.
Discounts can also reduce margin on purchases that would have happened anyway. In another hypothetical example, a $5 discount on 200 existing purchases costs $1,000 of contribution before any new customer gain is considered. Promoting a low-margin item can shift customers away from a higher-margin alternative, so inspect category or business contribution rather than celebrating the advertised item alone.
Compare a premium upgrade against the cheaper adequate option, not only against having no sign. If the premium option costs an additional $4,000 and each additional sale contributes $30, it needs at least 134 further sales to recover that extra outlay before additional upkeep. Prestige or a visual preference may still have value to an owner, but it should not be presented as measured profit.
If a café is also funding repeat-visit incentives, compare coffee shop loyalty programs as a separate expense with its own reward costs and measurement plan.
A practical measurement plan before buying
Write down the expected mechanism and the smallest commercial result that would justify the expense. For example: clearer entrance information should reduce failed arrivals, or a product message should increase category contribution. Record the baseline, included costs and decision threshold before seeing the outcome.
Where a reversible message can be changed legally, compare matched trading periods with and without it. Decide the schedule in advance and keep price, staffing and other promotion as steady as practical. Log deviations. A permanent installation may instead require a comparison location or careful before-and-after analysis; either can still be affected by unrelated changes.
Choose the observation period around the normal buying cycle and transaction volume. A quiet professional practice and a busy café will not produce equally informative evidence in a week. For low counts, report the counts and uncertainty rather than a dramatic percentage. A rise from one enquiry to two is not enough to justify a durable claim of doubled demand.
Check for a sustained change in completed sales and contribution, then compare it with the threshold. Keep the measured result separate from attribution: a later sales increase may coincide with the sign without being caused by it. If the result is inconclusive, say so; do not retrospectively choose the best-performing week as the proof.
Ottawa Reviews publishes the wider Ottawa research studies collection with the method and limits beside each report.
Turn the study into a comparable quote brief
Give each supplier the same photographs, dimensions, viewing direction, opening hours, objective and site constraints. Ask for an option that fixes the identified problem and, separately, any premium alternative. Keep price and scope together so a lower figure does not hide excluded work.
Request itemised design, material, installation, electrical, permit coordination, removal and disposal costs. Confirm who measures the site, secures approvals, signs off the proof and handles later repairs. Ask for a schedule tied to those dependencies rather than relying on an advertised generic turnaround.
The related sign-shop comparison and SpeedPro service review provide further enquiry questions. They are service research, not evidence that a supplier’s work produces superior profit. This study does not select a winning Ottawa sign company or manufacture an ordered ranking from published marketing claims.
The SpeedPro Ottawa review provides a closer look at one studio’s advertised services and unresolved enquiry details.
Sources and method
Prepared by Ottawa Reviews from the linked original research, supplier pages and official documents, accessed on 9 September 2026. Searches covered signage profit and sales evidence, Ottawa supplier costs, municipal approvals and regional traffic methods. Studies were retained for a clear method or directly relevant limitations; promotional uplift claims without traceable primary evidence were excluded. Results were not pooled because populations, interventions and outcomes differ. No original Ottawa fieldwork, paid-price survey, audited profit records, supplier interviews or qualified professional review was conducted. Illustrative calculations are labelled and reproducible.
Source access date: . The sources reviewed do not establish a citywide profit winner.
The Economic Value of On-Premise Signage
Jeff Rexhausen, Henry Hildebrandt and Christopher Auffrey. University of Cincinnati Economics Center. August 2012.
Original research · survey and case studies · US businesses; commissioned for the Signage Foundation
Used for: Limits of attributing business performance to individual sign changes; printed pp. 17–20.
Limit: Older, self-reported survey evidence; bundled changes cannot identify a winning sign type.
In-Store Advertising with Digital Signage
Dennis Herhausen, David de Jong and Dhruv Grewal. Journal of Marketing, 90(3), 81–103. 2026 issue; first online 9 June 2025; data 2018–2022.
Peer-reviewed field-experimental research · One retailer’s ten large stores in a western European region
Used for: Table 3, data-collection description and limitations; featured-product purchase outcome.
Limit: Different country and retail format; purchase odds do not establish storewide net profit.
Digital signage for promoting price discounts: First insights into customer spending on distant and nearby discounted products
Anastasia Nanni and Andrea Ordanini. Journal of Retailing, 100(2), 186–198. 2024.
Peer-reviewed field research · university-hosted full text · Two grocery-store experiments involving 7,009 customers
Used for: Abstract, experimental results and discussion of product distance.
Limit: Discount communications in a specific setting; does not compare Ottawa exterior signs or net profit.
How Much Does a Commercial Sign Cost in Ottawa? (2026 Pricing Guide)
Over Barahona. DSign LED. 28 February 2026.
Supplier-published price guidance · Advertised Ottawa pricing; design and fabrication included
Used for: Selected sign-category ranges; installation scope must be confirmed.
Limit: Not a binding quote, transaction dataset or representative market average; regulatory estimates are not used.
How Much Does a Storefront Sign Cost in Ottawa? (2026)
YAYA Prints. YAYA Prints. 26 June 2026.
Supplier-published price guidance · Advertised materials and typical installation for selected storefront formats
Used for: Four category ranges and comparison of included scope.
Limit: Not matched to DSign dimensions/materials; not an independent sample of completed purchases.
Permanent Signs on Private Property By-law 2016-326
City of Ottawa. City of Ottawa. Consolidated PDF includes Schedule A amendment 2026-149.
Official municipal by-law · Ottawa private-property permanent signs
Used for: Section 26 exemptions and Schedule A fees, PDF p. 77.
Limit: General framework; the exact sign, address and current amendments determine applicability.
2026 Adopted Budget Book — Condensed
City of Ottawa. City of Ottawa. 2026 adopted budget.
Official municipal fee schedule · 2026 user fees
Used for: Printed p. 256 (PDF p. 275) corroborates selected permanent-sign fees.
Limit: A fee schedule is not a permit decision or approval timeline.
The Good Neighbours (A-Frame Signs) Guide
City of Ottawa. City of Ottawa. Undated PDF; accessed 9 September 2026.
Official public-access guidance · A-frame placement and pedestrian clearways
Used for: Placement during business hours and keeping a usable route; PDF p. 2.
Limit: Guidance alone cannot approve a site; confirm current placement rules with the City.
Traffic Counts
TRANS Committee. TRANS Committee. Undated methodology; accessed 9 September 2026.
Regional transportation methodology · National Capital Region screenline traffic counts
Used for: Coverage, count periods and lack of seasonal normalisation.
Limit: Passing traffic is not measured sign exposure, customer intent or a storefront conversion count.